
1kw solar produces how many units depends on your sunlight, system losses and roof conditions, but a useful India planning figure is about 3.6 units per day. This guide shows the calculation, the monthly and yearly totals, and how to estimate the solar size for your own electricity bill.
Quick answer: about 3.6–4.5 units a day
Using a 1 kW system, 4.5 peak sun hours and 80% system efficiency:
Daily generation = system size × peak sun hours × system efficiency
                 = 1 kW × 4.5 hours × 0.80
                 = 3.6 kWh
                 = 3.6 units
One electricity unit is one kilowatt-hour (kWh). So, in this example, a 1 kW rooftop system produces 3.6 units on an average model day, not 1 unit for every hour of daylight.
In a strong-sun location, the same system may produce around 3.6–4.5 units per day after typical losses. The Government of India’s rooftop-solar FAQ says that 1 kWp can generate 4–5.5 units on a clear sunny day; that is a clear-day figure, not a promise for every day of the year. Read the official rooftop-solar FAQ.
The formula with India’s sun hours
The nameplate size tells you the maximum rated power of the panels under standard test conditions. Your roof does not receive that exact power all day, so the estimate uses peak sun hours and an efficiency factor.
Step 1: Convert the system size
For this article, the system size is 1 kW, or 1,000 W of panel capacity. A 1 kWp label means practically the same thing for this generation estimate: the peak rated output is 1 kW.
Step 2: Choose peak sun hours
Peak sun hours are not the same as the number of hours between sunrise and sunset. They combine the day’s sunlight into an equivalent number of hours at full rated intensity. The VatoWatt calculator starts with 4.5 peak sun hours, while your city may need a different input.
ISRO explains that solar potential depends on the location’s global horizontal irradiation (GHI) and provides monthly and long-term solar estimates through its Solar Calculator. You can also check a location in the Global Solar Atlas country data for India.
Step 3: Allow for system losses
The panels produce DC power, which is converted and delivered through the rest of the system. Temperature, inverter conversion, dust, cables, mismatch and other conditions mean that the usable AC output is lower than the ideal panel calculation.
For a simple estimate, use 80% system efficiency:
Ideal energy = 1 kW × 4.5 hours = 4.5 kWh
Usable estimate = 4.5 kWh × 0.80 = 3.6 kWh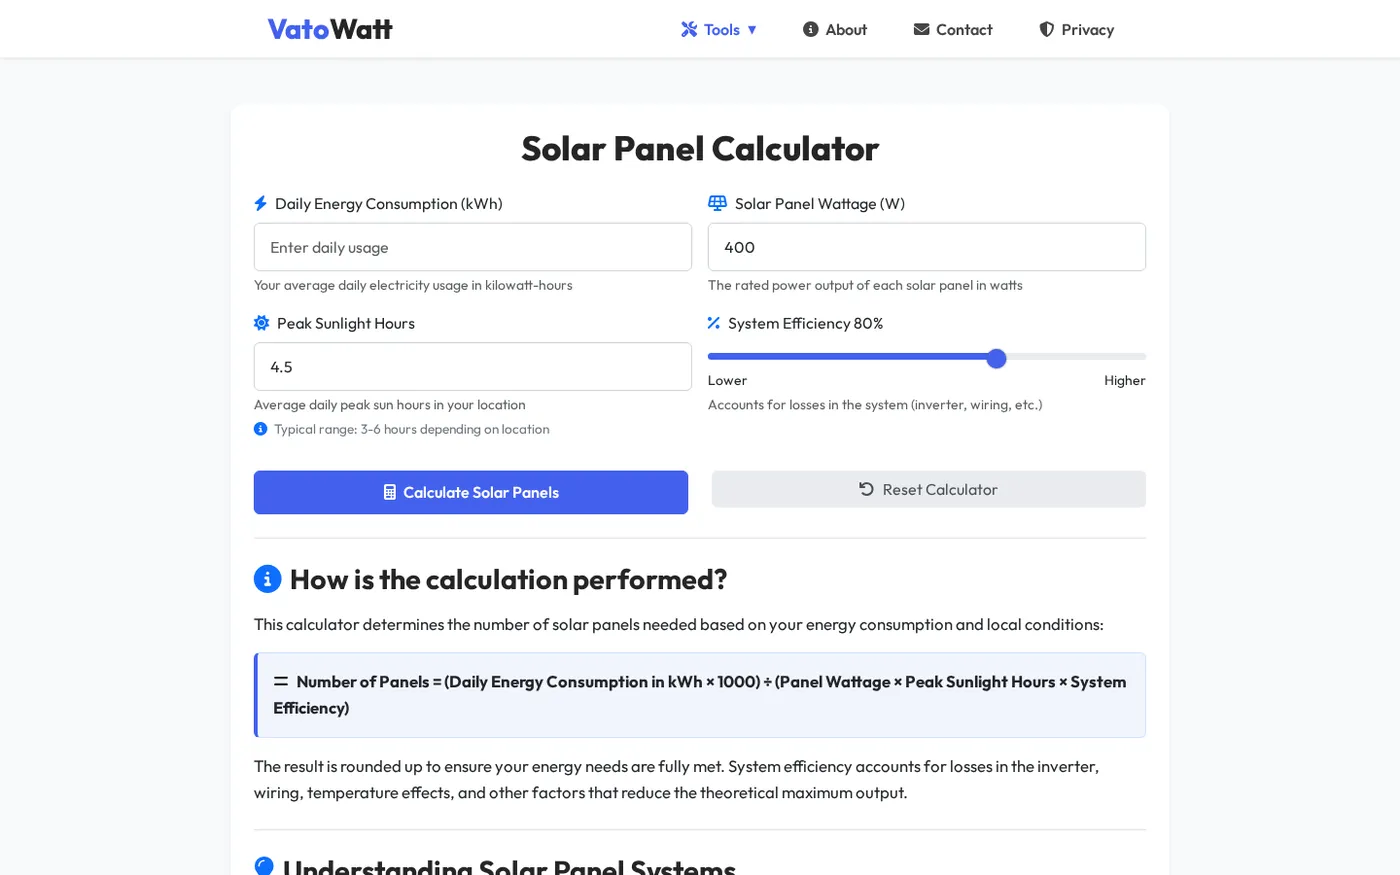
You can repeat the calculation with your own daily usage and local sunlight in the Solar Panel Calculator. It is more useful than copying a national average because the calculator lets you change the panel wattage, sun hours and efficiency.
State-wise sun-hour ranges: use them as planning bands
India does not have one fixed daily output. Solar resource changes with latitude, clouds, monsoon conditions, terrain, haze, shading and the direction and tilt of the roof. MNRE says most parts of India receive roughly 4–7 kWh per square metre per day of solar energy, while NISE reports a regional average GHI range of about 3.5–5.5 kWh per square metre per day in its Solar PV potential report.
The table below turns the broad regional pattern into illustrative peak-sun-hour bands for a first calculation. These are not official state averages. The output column is simply each band multiplied by 1 kW and 80% efficiency, so check your exact city in a solar-resource tool before final sizing.
| Location pattern | Illustrative peak sun hours | 1 kW estimate at 80% efficiency |
|---|---|---|
| Rajasthan and Gujarat interiors | 5.0–5.5 hours | 4.0–4.4 units/day |
| Deccan areas, including Karnataka, Telangana and Madhya Pradesh | 4.5–5.5 hours | 3.6–4.4 units/day |
| North Indian plains, including Punjab, Haryana, Delhi and Uttar Pradesh | 4.0–5.0 hours | 3.2–4.0 units/day |
| Coastal and southern locations | 4.0–5.0 hours | 3.2–4.0 units/day |
| Himalayan foothills and parts of the Northeast | 3.5–4.5 hours | 2.8–3.6 units/day |
This regional interpretation follows the official pattern that the Thar Desert and Deccan Plateau have higher irradiance, while Himalayan foothills and parts of the Northeast are lower. For a site-specific number, use the ISRO Solar Calculator or the Global Solar Atlas, then enter that value in the VatoWatt calculator.
Month-by-month and seasonal variation
The 3.6-unit result is an average-style estimate. Actual generation moves up and down every day, and a monthly total can differ even when your panel capacity has not changed.
| Months | What usually affects generation | How to read your result |
|---|---|---|
| January–February | Clear skies can help, but cooler-season haze and shorter days vary by location. | Use your location’s monthly solar data instead of assuming the clear-day maximum. |
| March–May | Longer, brighter days can improve output; high module temperature and dust can reduce the gain. | Good output is possible, but a hot day is not automatically the best day. |
| June–September | Monsoon clouds and rain can reduce peak sun hours and make daily output uneven. | Expect more variation and judge the season by its monthly total. |
| October–December | Post-monsoon skies may improve output, while haze, cloud and shorter days still matter. | Recheck the local monthly profile when estimating annual generation. |
For a simple 30-day estimate, multiply the daily result by 30:
3.6 units/day × 30 days = 108 units/monthDo not read this as 108 guaranteed units on every bill. A cloudy monsoon month may be lower, while a bright month may be higher. Panel cleanliness, shade from a new building or tree, roof direction, tilt and downtime can also change the meter reading.
Units per month and year
The following table uses the same 4.5-hour and 80%-efficiency assumptions. It is a planning table for a 1 kW system, not a guaranteed generation schedule.
| Period | Calculation | Estimated generation |
|---|---|---|
| One day | 1 × 4.5 × 0.80 | 3.6 units |
| 30 days | 3.6 × 30 | 108 units |
| 31 days | 3.6 × 31 | 111.6 units |
| 365 days | 3.6 × 365 | 1,314 units/year |
If you use a broader 3.2–4.4 units/day planning band, a 30-day month works out to about 96–132 units. That spread is why a solar quote that says “units per day” should also state the location, the assumed sun hours and whether the number is an ideal, clear-day or loss-adjusted estimate.
Generation and consumption are also different things. A grid-connected system produces during daylight; your home may use some power directly, while the rest may flow to the grid under the applicable metering arrangement. MNRE explains that solar output is available in the daytime and that net-metered systems record energy exported to and drawn from the grid. See the official rooftop-solar FAQ.
How many kW does your bill need?
Start with your average daily units, then divide by the expected daily output of each 1 kW of solar:
Required solar size in kW = daily electricity use ÷ (peak sun hours × efficiency)Using 4.5 sun hours and 80% efficiency, each 1 kW is estimated at 3.6 units/day.
| Monthly bill usage | Average daily use | First-pass solar size |
|---|---|---|
| 100 units/month | 3.3 units/day | 0.93 kW, roughly 1 kW |
| 200 units/month | 6.7 units/day | 1.85 kW, roughly 2 kW |
| 300 units/month | 10 units/day | 2.78 kW, roughly 3 kW |
For example, if your bill shows 200 units in a 30-day month:
Daily use = 200 ÷ 30 = 6.67 units/day
Solar size = 6.67 ÷ 3.6 = 1.85 kW
That 1.85 kW is a first pass. Before choosing a system, replace 4.5 with your location’s solar data and consider roof shade, available area, daytime usage and the metering setup permitted by your electricity provider. To calculate your actual appliance usage instead of estimating from the bill, use the Power Consumption Calculator.
If you plan to store solar energy in a battery for evening use, generation size and battery backup time are separate calculations. The Battery Backup Time Formula explains how battery voltage, amp-hours, load and efficiency affect runtime.
Common mistakes when estimating 1 kW solar output
- Confusing kW with kWh. kW is the system’s power rating; kWh, or units, is the energy produced over time.
- Multiplying 1 kW by 12 hours of daylight. Panels do not operate at full rated output for every daylight hour. Use peak sun hours.
- Ignoring system efficiency. The ideal 4.5 kWh from 1 kW × 4.5 hours becomes 3.6 kWh after the 80% loss allowance.
- Treating a clear-day number as an annual average. Clouds, rain, haze, heat and shade can reduce individual days and months.
- Assuming generation equals bill reduction. Your saving depends on when you use electricity and how your grid-metering arrangement handles exported power.
FAQ
How many units does a 1 kW solar system produce in one day?
Using 4.5 peak sun hours and 80% system efficiency, the estimate is 1 × 4.5 × 0.8 = 3.6 units per day. A clear day in a strong-sun location can be higher, while clouds, shade and heat can make the actual reading lower.
How many units does a 1 kW solar system produce in a month?
At the 3.6-unit planning estimate, it produces about 108 units in 30 days and about 1,314 units in a year. Treat these as estimates: your local monthly solar resource and system conditions determine the meter reading.
Is 1 kW solar enough for a home?
It depends on your average daily consumption and how much of that energy you use during the day. At the 3.6-unit estimate, 1 kW covers roughly 100 monthly units as a first pass; use your bill and the Solar Panel Calculator for a more suitable size.
How many panels are needed for a 1 kW solar system?
The count depends on the wattage of each panel. With 400 W panels, 1,000 W ÷ 400 W is 2.5, so three panels would be needed physically and their nameplate total would be 1.2 kW; the final design should use the exact panel and inverter ratings.